
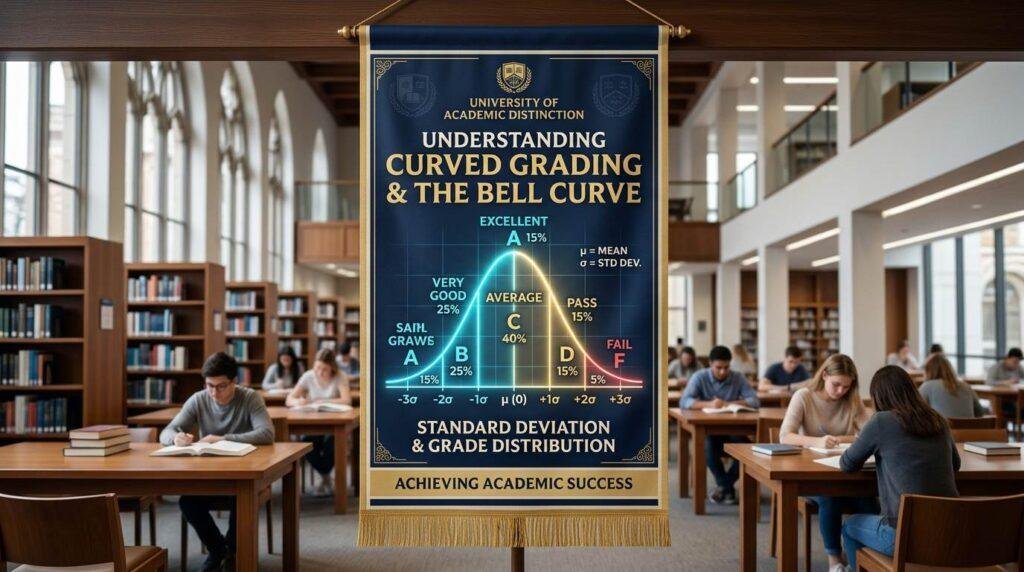
Curved Grading & Bell Curves Explained: Best 2026 College Guide
Navigating higher education requires mastering unfamiliar evaluation frameworks, and Curved Grading & Bell Curves Explained represents one of the most critical statistical concepts every university undergraduate must understand. In traditional secondary classrooms, academic success follows an absolute criterion-referenced model where scoring ninety percent guarantees an A, regardless of peer performance. In competitive university courses, however, professors frequently calibrate final marks against cohort distributions. Understanding Curved Grading & Bell Curves Explained provides the quantitative clarity needed to interpret exam percentiles, calculate GPA trajectories, and excel in competitive classrooms.
Try it yourself: Use our free curved grade and final exam calculator to run your bell curve grades in seconds. No sign-up needed.
Quick Answer
Curved grading is a norm-referenced evaluation method where student grades are determined by performance relative to peers rather than absolute point totals. Under Curved Grading & Bell Curves Explained, raw exam marks are mathematically adjusted based on the class mean, standard deviation, or top-performing scores.
For example, on a notoriously difficult organic chemistry midterm with a class average of 52% and a standard deviation of 12%, an examinee scoring 68% sits more than one standard deviation above the mean, converting an apparent D+ into a solid B+ or A- under Curved Grading & Bell Curves Explained.
Use the interactive calculator above to simulate your own raw score, class average, standard deviation, and target grade distribution.
Table of Contents
How Does Curved Grading & Bell Curves Work?
To understand how relative grading functions, one must examine the distinction between criterion-referenced grading and norm-referenced grading. While standard high school classes evaluate students against fixed percentage scales, Curved Grading & Bell Curves Explained establishes that grades reflect relative class rank and statistical cohort clustering.
When university instructors implement curved grading frameworks, individual exam submissions become discrete data points across a Gaussian probability curve. If an exceptionally rigorous physics midterm yields an average of 44%, Curved Grading & Bell Curves Explained ensures that the class average maps onto a passing departmental standard such as a C+ or B-, preventing widespread course failure caused by test design difficulty.
Departments adopt relative grading systems for three foundational institutional purposes:
- Calibrating Test Difficulty: Standardizing variations between exam difficulty across different semesters and instructors.
- Preventing Grade Inflation: Maintaining degree credential integrity by preventing artificial grade compression at the top tier.
- Normalizing Multi-Section Courses: Eliminating grading discrepancies between lenient and strict teaching assistants.
Raw Score vs. Curved Grade Examples
A raw exam score does not tell the full story in a curved college course. Depending on the class mean and standard deviation, identical raw scores produce entirely different letter grades under Curved Grading & Bell Curves Explained.
| Raw Exam Score | Class Mean (μ) | Standard Deviation (σ) | Calculated Z-Score | Projected Letter Grade | Curving Impact |
|---|---|---|---|---|---|
| 48% | 40% | 8% | +1.00 σ | B / B+ | Significant Upward Boost |
| 62% | 50% | 12% | +1.00 σ | B / B+ | Moderate Upward Boost |
| 68% | 52% | 14% | +1.14 σ | B+ (3.3 GPA) | Generous Academic Calibration |
| 78% | 75% | 8% | +0.38 σ | B- / C+ | Minor Upward Adjustment |
| 88% | 90% | 4% | -0.50 σ | C / C+ | Downward Competitive Pressure |
As demonstrated in this comparative table, Curved Grading & Bell Curves Explained proves that earning a 68% in a rigorous STEM lecture often delivers a stronger grade than earning an 88% in an uncalibrated course with high score clustering.
The Mathematical Foundation: How a Bell Curve Is Calculated
The statistical foundation of Curved Grading & Bell Curves Explained rests upon the classical normal distribution formulated by mathematician Carl Friedrich Gauss. A standard bell curve represents a continuous probability distribution that is perfectly symmetrical around its arithmetic mean.
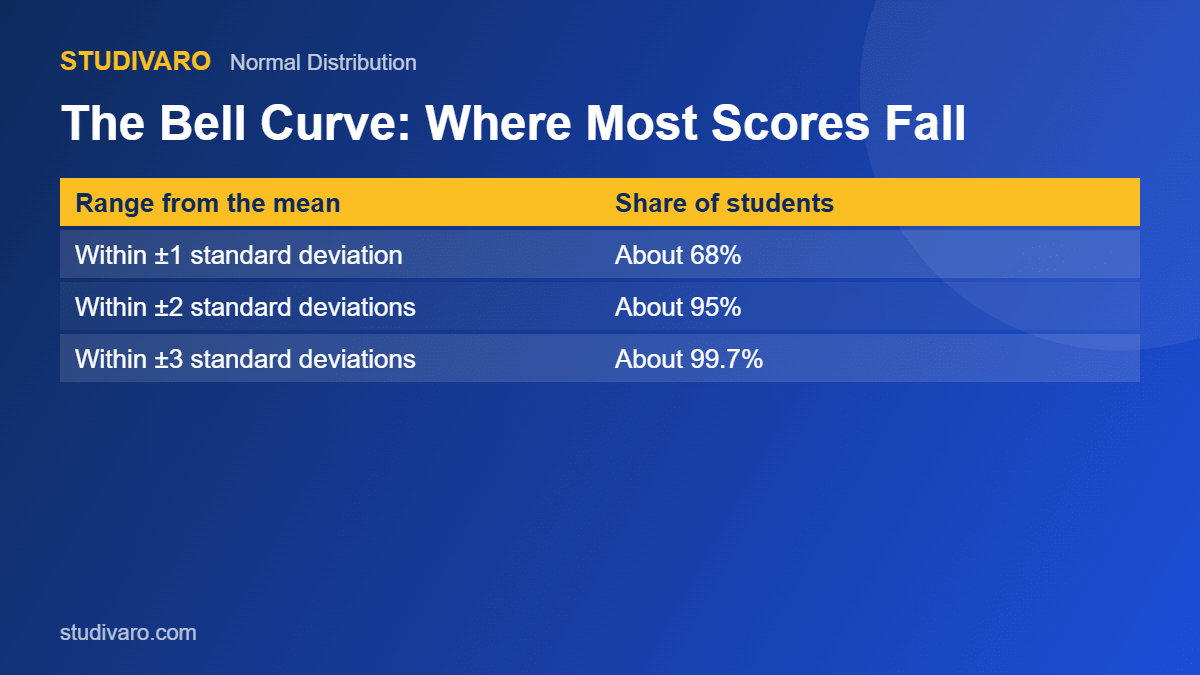
Standard Normal Distribution (Bell Curve) Mean (μ) | .-"-. .' '. / \ .' '. / \ .----' '----. / \ -3σ -2σ -1σ +1σ +2σ +3σ (0.1%) (2.1%) (13.6%) (13.6%) (2.1%) (0.1%) |----------- 68.2% -----------| |------------------- 95.4% -------------------| |------------------------- 99.7% -------------------------|
In any course governed by standardized grade curves, two statistical variables determine grade boundaries:
- The Class Mean (μμ): The arithmetic average of all exam scores, representing the exact center of the distribution.
- The Standard Deviation (σσ): The measure of dispersion quantifying how tightly or broadly scores spread around the central average.
Under the empirical three-sigma rule central to Curved Grading & Bell Curves Explained, approximately 68.2% of all students score within one standard deviation (μ±1σ), 95.4% fall within two standard deviations (μ±2σ), and 99.7% fall within three standard deviations (μ±3σ).
Worked Example: Converting a 68% Raw Score to a B+ on a Curve
To observe Curved Grading & Bell Curves Explained in action, consider an undergraduate student taking an advanced biochemistry midterm:
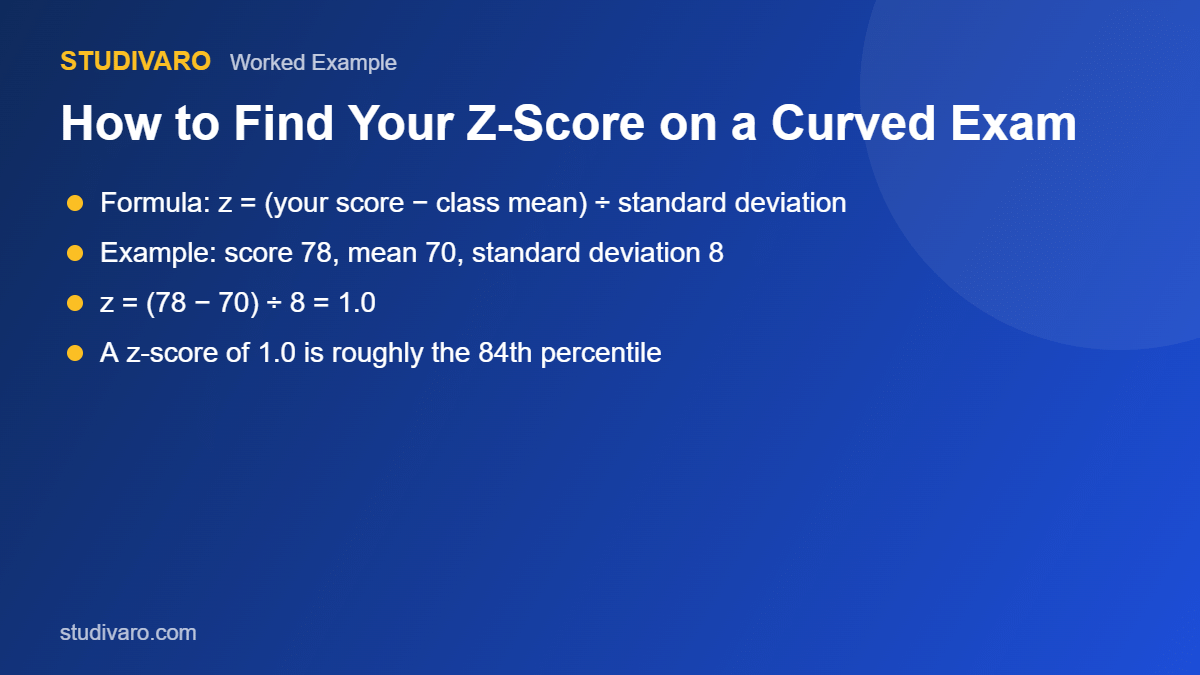
- Student Raw Score (XX): 68%
- Class Mean (μμ): 52%
- Class Standard Deviation (σσ): 14%
- Departmental Curve Center: Mean set to 76% (C+) with a normalized standard deviation of 10%
Step 1: Calculate the Statistical Z-Score
Under relative curve mechanics, the z-score quantifies how many standard deviations the student sits above the cohort average:
z=σX−μ=1468−52=1416≈+1.14σ
Step 2: Map the Z-Score to the Normalized Curve
Next, Curved Grading & Bell Curves Explained translates this standard deviation standing into the normalized class scale:
Curved Score=Target Mean+(z×Target SD)=76+(1.14×10)=87.4%
Step 3: Determine the Final Letter Grade
A curved score of 87.4% translates directly into a B+ (3.3 GPA). Without the application of Curved Grading & Bell Curves Explained, the raw score of 68% would have registered as a failing or near-failing D+ on an absolute scale.
Comparison of the 5 Common College Grading Curve Formulas
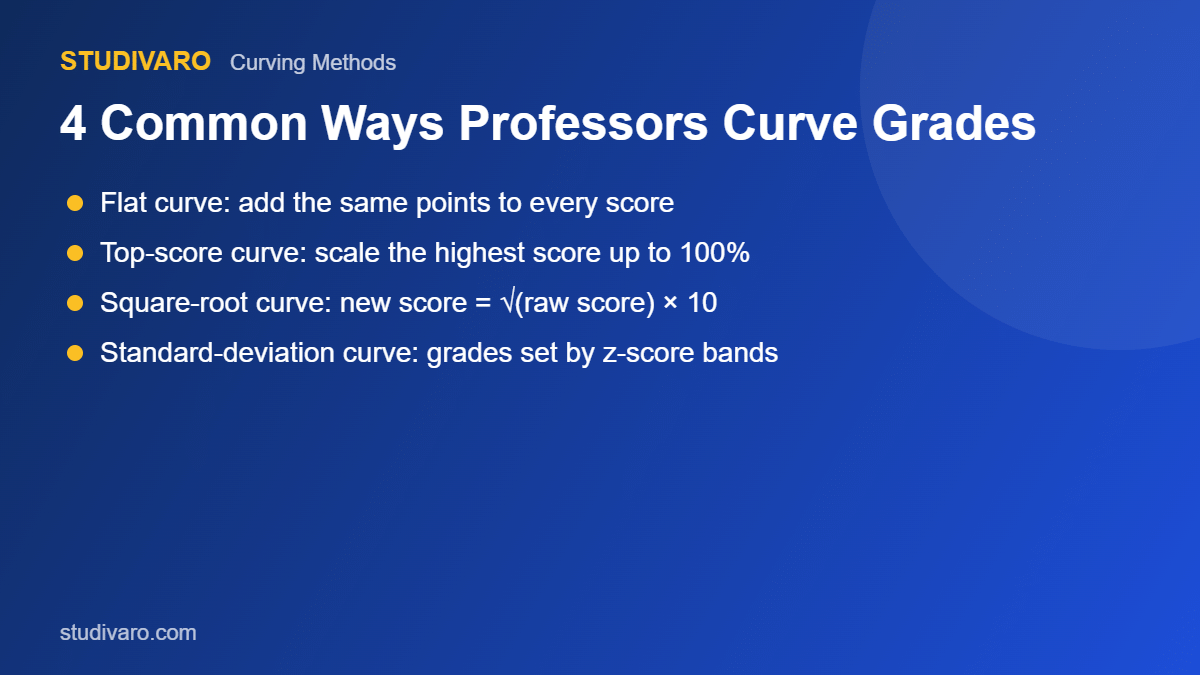
Professors apply diverse mathematical scaling options, and Curved Grading & Bell Curves Explained encompasses five distinct institutional methodologies.
| Curving Method | Mathematical Formula | How It Operates | Best For |
|---|---|---|---|
| Top-Scorer Linear Bump | Curved=Raw+(100−Max) | Adds the difference between high score and 100 to everyone | Fair exams with one very hard question |
| Standard Deviation Bell Curve | Curved=Meantarget+(z×σtarget) | Forces distribution into set statistical standard deviation tiers | Large multi-section lecture cohorts |
| Square Root Curve Scale | Curved=Raw×10 | Takes square root of raw score and multiplies by 10 | Disproportionately lifting low scores |
| Linear Proportional Scaling | Y=mX+b | Maps lowest and highest raw scores onto target numerical bounds | Uniform scaling without changing rank |
| Minimum Grade Floor Policy | Floor=max(Raw,50%) | Sets 50% baseline floor for all completed exam submissions | Preventing cumulative GPA destruction |
Each of these variations under standard deviation curves creates distinct winners and losers, making it vital to confirm which mathematical model your syllabus enforces.
What Affects Your Final Curved Grade?
Your final marks under Curved Grading & Bell Curves Explained depend on multiple interdependent statistical and structural factors:
1. Class Mean and Cohort Average
The central average serves as the fulcrum of Curved Grading & Bell Curves Explained. When the class mean drops due to high exam difficulty, raw scores carry significantly higher relative weight.
2. Standard Deviation and Score Dispersion
A tight standard deviation means scores cluster closely around the mean, where earning just three additional points can leapfrog your percentile rank under curved examination frameworks.
3. Departmental Mandates and Grade Quotas
Institutional regulations often mandate fixed letter grade quotas, ensuring that Curved Grading & Bell Curves Explained restricts top A grades to a predetermined percentage of enrolled students.
4. Exam Design and Difficulty Outliers
When professors include advanced analytical questions, Curved Grading & Bell Curves Explained separates upper-quartile performers from the central median cluster.
5. Teaching Assistant Grading Variations
In large multi-section courses, academic curve mechanisms balance discrepancies between lenient and strict section graders across diverse laboratory sessions.
Curved Grading in Pre-Med, STEM, and Law School
Professional programs utilize Curved Grading & Bell Curves Explained to gatekeep admissions and establish competitive class ranks.
In pre-medical tracks, Curved Grading & Bell Curves Explained governs organic chemistry, biochemistry, and general physics. Because medical school admissions committees evaluate national applicant GPAs through standard systems like the AMCAS BCPM GPA calculation guide, undergraduate curves ensure institutional rigor remains visible on official transcripts.
Similarly, American Bar Association accredited law schools mandate strict curving guidelines, making Curved Grading & Bell Curves Explained central to first-year law school survival. Law faculties frequently mandate that exactly 15% to 20% of first-year cohorts receive A grades, while 55% to 60% receive B grades, directly influencing LSAC GPA recalculation rules, on-campus interview selection, and judicial clerkships.
Common Curved Grading Mistakes and Myths
Undergraduates frequently harbor misconceptions regarding Curved Grading & Bell Curves Explained, leading to unnecessary academic anxiety:
Mistake 1: Assuming a Low Raw Score Means Failure
Receiving a 55% feels alarming, but Curved Grading & Bell Curves Explained frequently reveals that a 55% represents an above-average score on a challenging midterm.
Mistake 2: Believing All Curves Automatically Raise Grades
In strict norm-referenced bell curves governed by Curved Grading & Bell Curves Explained, scores can theoretically decrease if cohort clustering forces proficient students below arbitrary cutoffs.
Mistake 3: Ignoring the Standard Deviation Spread
Students often monitor only the mean, yet Curved Grading & Bell Curves Explained demonstrates that standard deviation determines how rapidly grades shift along distribution tails.
Mistake 4: Treating Relative Grading as Absolute Mastery
A high curved grade confirms strong relative cohort standing under Curved Grading & Bell Curves Explained, but foundational comprehension remains essential for cumulative sequential courses.
Mistake 5: Failing to Check the Syllabus for the Exact Formula
Assuming a professor uses a top-scorer bump when they actually enforce Curved Grading & Bell Curves Explained standard deviations leads to miscalculated study investments.
How to Use the Curved Grading Calculator
Our interactive calculator operationalizes Curved Grading & Bell Curves Explained into a practical planning tool:
- Enter your raw exam score out of 100.
- Input the published class mean and standard deviation from your course portal.
- Select your syllabus curving methodology (Standard Deviation Bell Curve, Top-Scorer Bump, or Square Root Scale).
- Review your instantaneous z-score, class percentile standing, and projected letter grade.
Strategic Action Steps to Excel in Curved Courses
Succeeding in courses governed by Curved Grading & Bell Curves Explained requires proactive academic tactics:
- Inspect Course Syllabi Early: Confirm grading boundaries and formula specifications during syllabus week.
- Target High-Difficulty Exam Problems: Master complex analytical questions that push your z-score into upper percentiles under Curved Grading & Bell Curves Explained.
- Leverage Faculty Office Hours: In courses where Curved Grading & Bell Curves Explained dictates borderline decisions, direct faculty engagement demonstrates student commitment.
- Maintain Composure During Score Releases: Always contextualize individual raw results against class averages and standard deviations before considering course drops.
Frequently Asked Questions
What is the difference between straight grading and curved grading?
Straight grading measures achievement against fixed numerical thresholds where 90% always yields an A, whereas Curved Grading & Bell Curves Explained evaluates achievement relative to peer cohort distributions.
Can your grade go down under a curved grading system?
Yes, under strict quota-based models of Curved Grading & Bell Curves Explained, grades can theoretically adjust downward if the entire class achieves high marks and quotas restrict top grades.
How does the square root curve formula work?
Under the square root model of Curved Grading & Bell Curves Explained, an examinee takes the square root of their raw mark and multiplies by ten, transforming a raw 64% into an 80%.
Why do organic chemistry and STEM classes use curved grading?
STEM programs utilize Curved Grading & Bell Curves Explained because technical examinations are intentionally designed with high difficulty to test problem-solving boundaries, yielding naturally low raw averages.
How do law school mandatory grading curves work?
Law schools enforce administrative policies under Curved Grading & Bell Curves Explained that mandate exact percentage allocations for A, B, and C grades across first-year cohorts.
Does curved grading affect scholarship eligibility?
Because merit scholarships require minimum cumulative GPAs, courses evaluated under Curved Grading & Bell Curves Explained directly impact retention thresholds when competitive distributions depress grade averages.
Related Student Tools
Explore our comprehensive suite of academic planning calculators:
- The Carnegie 2:1 Study Hour Rule Explained: Calculate weekly study workloads, lecture hours, and credit hour time commitments.
- College Major Salary-to-Debt Ratio Calculator: Compare projected graduate earnings against total undergraduate student debt.
- College Attendance Policies & Safe Bunk Margins: Estimate permissible lecture absences without triggering academic penalties.
- Student Loan Monthly Payment Calculator: Project monthly loan repayments and total interest costs over standard terms.
- How Much Does a Missed College Lecture Cost: Understand the true financial cost of skipping undergraduate classes.
Final Takeaway
Mastering Curved Grading & Bell Curves Explained transforms academic evaluation from an intimidating puzzle into an actionable strategic advantage. By tracking cohort means, calculating z-scores, and preparing for high-difficulty exam problems, students navigate competitive curves with confidence, protecting their GPA and achieving collegiate success.
Curved Grading & Bell Curves Calculator
Calculate your curved exam score, z-score standard deviation, class percentile rank, and projected letter grade across diverse university curving formulas.
Curved Grade Calculator Formula: Standard Deviation vs Square Root Curve
When professors announce that an exam will be curved, they typically calculate adjusted scores using one of two standard mathematical models:
- 1. The Square Root Curve (Most Popular for Tough Exams):
Curved Score = 10 × √(Raw Score). For example, a raw exam score of 64% transforms into:10 × 8 = 80% (Grade B). - 2. Flat Bump to the Highest Score:
Adjustment = 100 - Highest Earned Score. If the top student earned 92%, every student receives an automatic +8 point bump.
Use our Final Exam Grade Calculator to determine what curved or uncurved score you need on your upcoming finals to lock in your desired course grade.